250+ Automation RulesAI Powered DEX

AI Powered Digital Employee Experience

AI-powered DEX scoring, 250+ automation rules, and measurable workforce outcomes across every managed endpoint — the organizations that win on employee experience are those that fix problems before employees notice them.

XpediOo continuously computes a composite experience score from real telemetry across Device Performance, Application Health, Connectivity, and Employee Sentiment, then a rule engine with 250+ configurable scenarios acts — automatically, with blast-radius, cooldown, and approval controls — to resolve conditions before they generate service desk tickets.

250+
Automation Rules
4
DEX Scoring Pillars
8
Trigger Categories
40+
Trigger Types
The case for change

Why traditional IT metrics can't capture employee experience

Uptime is not experience. Availability is not satisfaction. The gap between IT's view and the employee's reality is where productivity is lost.

The measurement gap

Server uptime, patch compliance, and ticket SLAs measure IT's view of the system. They don't answer whether a device is fast enough, applications are reliable, or employees feel supported.

The delay problem

A service desk ticket is a lagging indicator — by the time an employee submits one, they've already lost time and formed a negative judgment. Many never submit a ticket at all.

The scale problem

A network issue affecting 40 devices in one subnet, or a crash-rate spike after an update, is invisible to a help desk watching for tickets across thousands of endpoints.

The proof-of-value problem

Without a measurement framework, IT can't credibly show a CHRO or CFO that a refresh, upgrade, or consolidation actually improved employee productivity.

Platform philosophy

From reactive IT support to proactive experience intelligence

The organizations that win on employee experience are those that fix problems before employees notice them.

1

Every score, AI insight, and automation rule fires on real endpoint telemetry — not samples, estimates, or self-reported figures

2

A composite four-pillar score pinpoints exactly which dimension — device, app, connectivity, or sentiment — is responsible for a poor experience

3

AI is an operating layer woven throughout the platform, not a single bolt-on feature

4

250+ governed automation rules resolve conditions before they generate a service desk ticket

5

Every automated action is governed — approval workflows, blast-radius caps, cooldown windows, dry-run simulation, and an immutable audit trail

6

Peer benchmarking and AI-generated executive briefings connect daily telemetry to boardroom investment decisions

Operating model

How XpediOo DEX operates in practice

The same four-step cycle repeats across the platform: measure the baseline, activate the highest-value rule, review results, and report outcomes to leadership.

STAGE 1

Measure the baseline

Deploy telemetry across the fleet and run an initial score rebuild to establish the composite and pillar-level starting point.

STAGE 2

Activate the highest-value rule

Use AI gap analysis to identify the automation opportunity with the highest fleet coverage, then build and approve the rule.

STAGE 3

Review results and expand coverage

Monitor execution history and tickets prevented, adjust blast-radius and cooldown settings, and add the next rule.

STAGE 4

Report outcomes to leadership

Generate an executive briefing that connects score improvement and ticket deflection to the investment decision.

Built for high-impact operations

250+ automation rules and AI woven through every stage

AI is not a single feature in Xpedioo DEX — it is an operating layer woven throughout, backed by a governed automation engine that resolves conditions before they become tickets.

High-Impact Features

Automation control across the endpoint estate

250+ governed automation rules across 8 trigger categories and 40+ specific trigger types
Every rule is built through a three-step wizard — Configuration, Script Builder, Review — and enters pending_approval until an administrator or manager signs off
Blast-radius percentage caps and cooldown windows bound every execution to a safe, reversible share of the affected population
Dry-run simulation shows exactly which endpoints a rule would touch before it ever runs live
A rollback endpoint reverses a completed execution's effects on the endpoints where it succeeded
Composite rules chain multiple actions — restart a service, then ticket, then alert — into a single governed playbook
Visual Flow Designer extends automation into multi-step, multi-system orchestration with native Jira and ServiceNow nodes
Scoped external API keys let ITSM, monitoring, and CI/CD systems trigger specific rules without console access
AI Features

AI as an operating layer, not a bolt-on feature

Per-endpoint AI analysis with an overall experience summary, four pillar-level insights, and recommended actions ranked by impact
AI gap analysis scans the rule library against fleet conditions to surface automation coverage gaps and recommend new rules
Help Desk AI Copilot converts plain-English questions into safe, read-only SQL queries against live fleet data
AI-generated executive briefings translate DEX telemetry into board-ready business language, saved and compared across periods
AI Tool Adoption Intelligence tracks Microsoft Copilot, ChatGPT Enterprise, and Claude Enterprise usage against industry benchmarks
AI-assisted script builder drafts PowerShell, Bash, or Python remediation scripts inside the rule wizard
Graceful fallback guides operators to the right pillar telemetry for manual review whenever the AI service is unavailable
Automation command center

Govern every rule before it reaches an endpoint

DEX Automation

A live view of rule inventory, approval status, execution volume, and tickets prevented — with simulation, scan impact, API key, and approval controls on every rule.
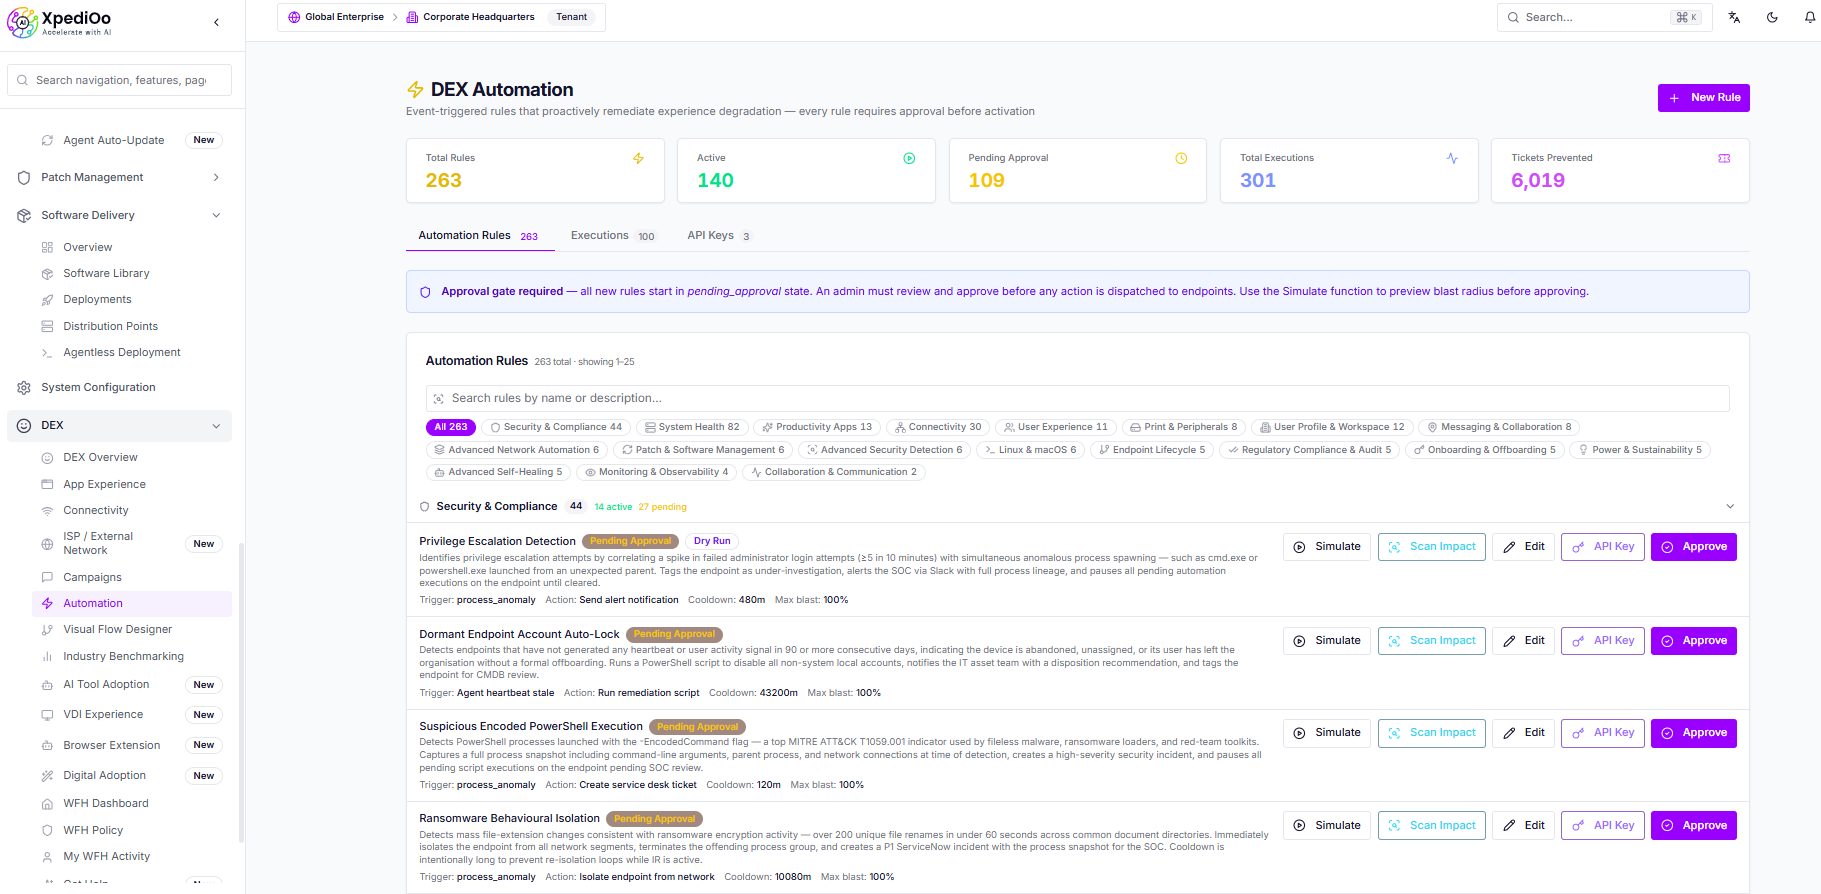
XpediOo DEX Automation dashboard showing automation rules, approval status, simulations, executions, and tickets prevented
Screenshot: the DEX Automation workspace with governed rule execution and approval controls.
System Health automation

Keep endpoints healthy without disrupting users

Endpoint Health Maintenance

Schedule governed tune-up tasks across Windows and Linux endpoints — from browser, package, cache, log, registry, and DNS cleanup to disk-space reporting and system maintenance.
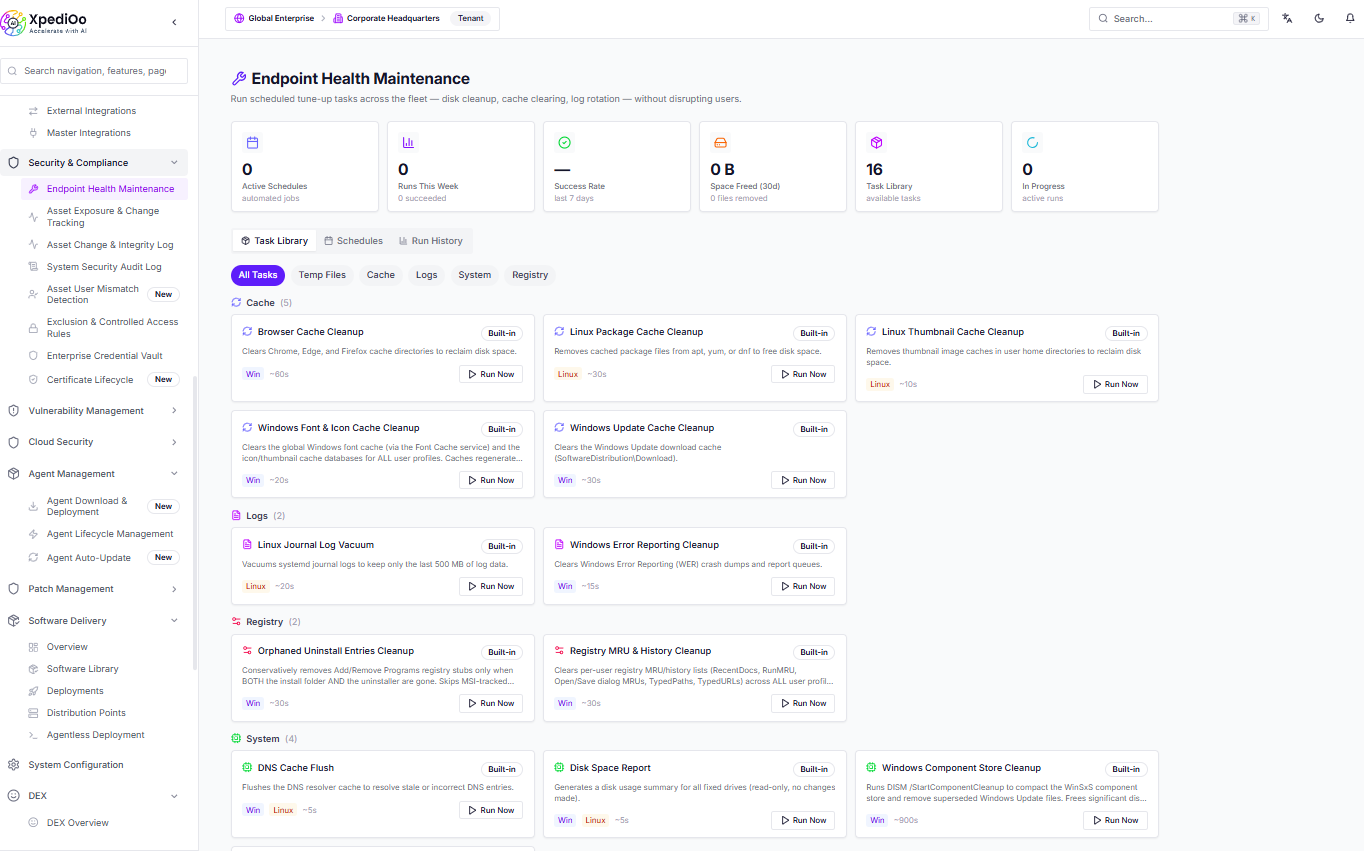
XpediOo Endpoint Health Maintenance dashboard showing scheduled system health tasks, task categories, run history, and run-now controls
Screenshot: the Endpoint Health Maintenance task library for governed System Health remediation.
Four-pillar scoring

A composite DEX score that pinpoints where experience breaks down

A single score that says "experience is poor" is not enough. The four-pillar model tells you exactly which dimension is responsible.

Coverage 1

Device Performance

Hardware health, resource utilisation, and failure prediction — the foundation every application experience runs on.

  • CPU utilisation, memory pressure, disk I/O saturation, and disk capacity across every managed endpoint
  • Hardware failure forecasting, battery health tracking, and boot-time/uptime anomaly triggers
Coverage 2

Application Health

Crash rates, launch latency, and real application reliability — where digital experience becomes a productivity fact.

  • Crash events, hang detection, launch latency, and version compliance from endpoint agents and the browser extension
  • Automated response to crash-rate spikes, version-floor violations, and shadow IT detection
Coverage 3

Connectivity

Wi-Fi stability, VPN reliability, DNS quality, and network path intelligence for office, remote, and hybrid employees.

  • Wi-Fi signal and stability, VPN authentication, DNS resolution, and gateway reachability
  • Three-segment LAN / ISP / cloud path attribution for remote and hybrid workforces
Coverage 4

Employee Sentiment

Quantifying how employees feel about their digital experience — the dimension objective telemetry can't measure alone.

  • Targeted DEX campaign surveys scored into the Sentiment pillar of every endpoint's composite score
  • Correlate subjective sentiment against objective device, app, and connectivity telemetry
DEX score overview

See the employee experience picture at a glance

Four-pillar visibility

The DEX Overview brings composite scores, fleet bands, pillar averages, endpoint-level scores, and data confidence into one operational view.
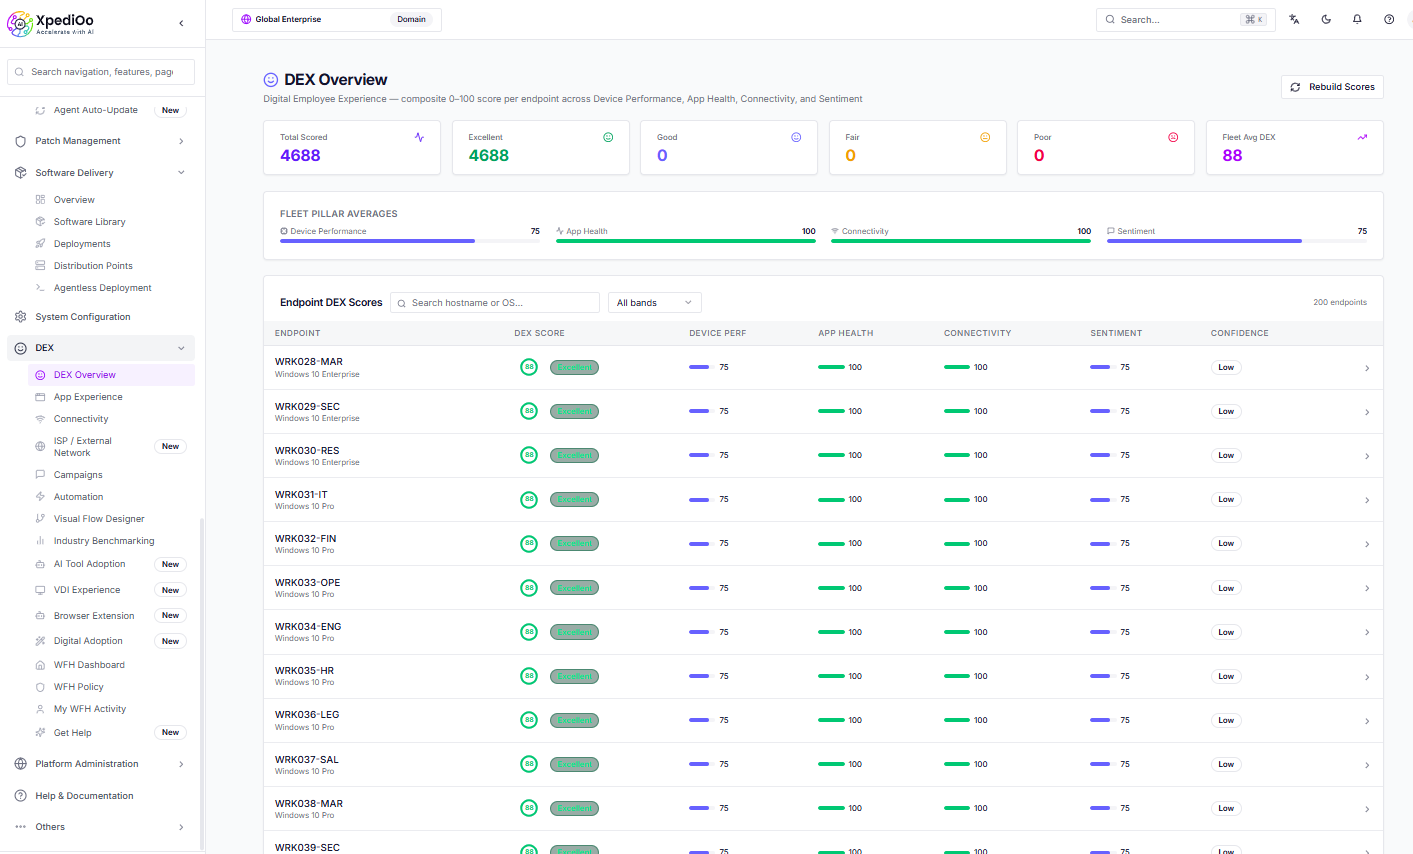
XpediOo DEX Overview dashboard showing composite scores, four pillar averages, endpoint DEX scores, and confidence levels
Screenshot: the DEX Overview dashboard with fleet-level and endpoint-level four-pillar scoring.
DEX score intelligence

Score history, per-endpoint factors, and the data confidence model

A score is only useful if you understand what is driving it, how it has changed, and how confident you should be in the data behind it.

Top factors

Ranked contributing factors

Each score's top contributing factors combine a pillar, a factor name (e.g. memory pressure, Wi-Fi signal strength), a detail explanation, and an impact weight.

Score history

Trend and regression detection

Per-endpoint score history enables before-and-after measurement for every automation intervention and detects cyclical or sudden degradation.

Data confidence

Confidence-weighted scoring

Scores from full four-pillar telemetry carry high confidence; partial telemetry — a missing browser extension or intermittent Satellite Client — is flagged as lower confidence.

Band filtering

Excellent / Good / Fair / Poor

Operators filter the fleet by score band to focus remediation effort on the endpoints with the most severe experience conditions first.

DEX peer benchmarking

Put your experience score in context

Industry comparison

Compare composite and four-pillar scores with anonymized peer data by industry sector and company size, then see exactly where your experience stands against the median and top quartile.
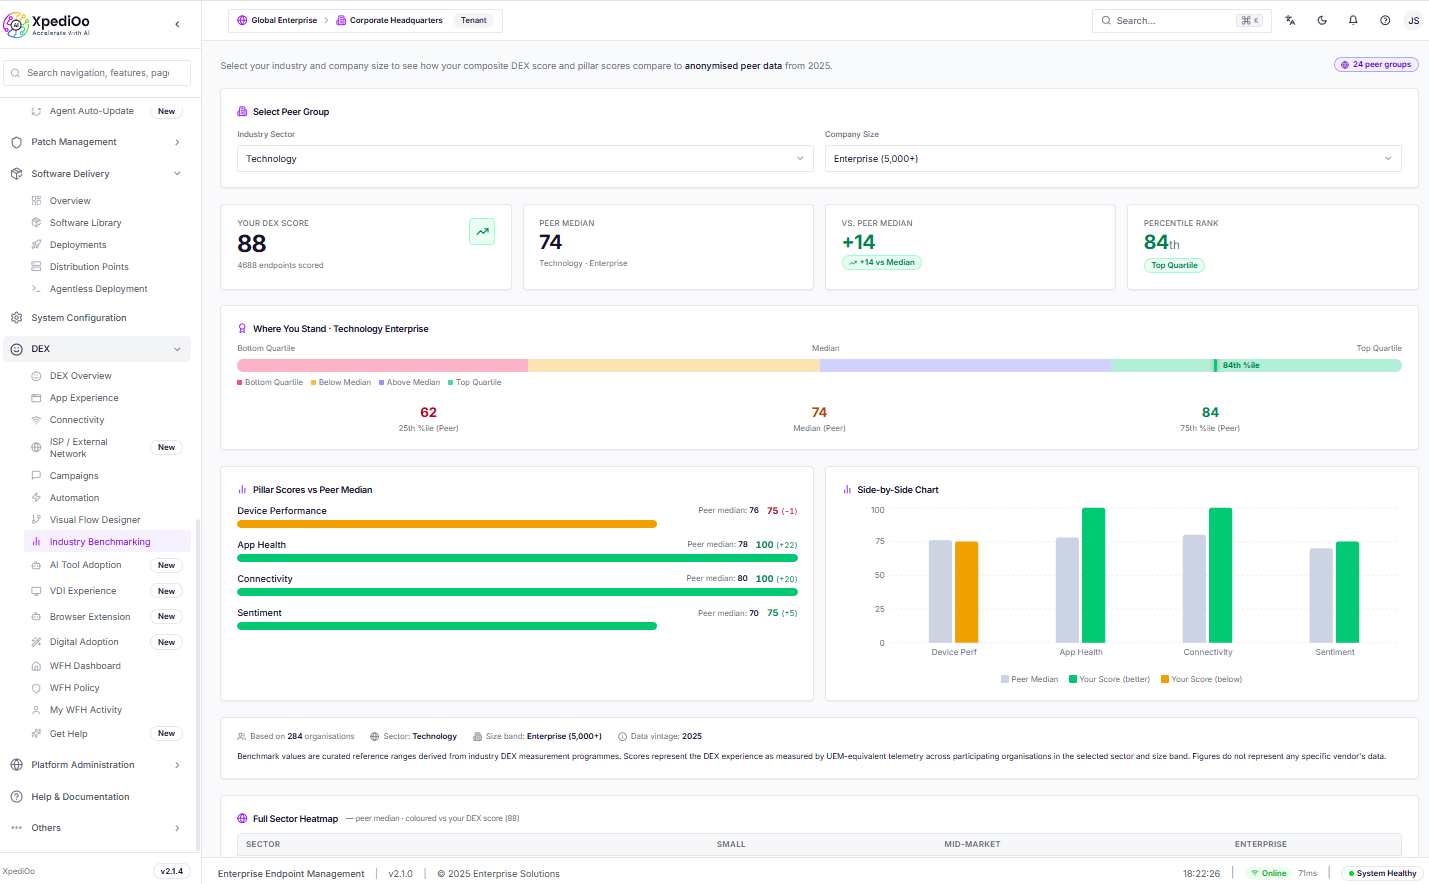
XpediOo Industry Benchmarking dashboard comparing DEX score and four pillar scores against anonymized technology enterprise peers
Screenshot: the Industry Benchmarking workspace comparing composite DEX performance and pillar scores against peer organizations.
Automation governance

Every rule governed: approval, blast radius, cooldown, dry run, and rollback

The power of 250+ automation scenarios is only enterprise-safe when every rule is approved, every execution is bounded, and every action can be reversed.

1

Three-step rule wizard

Every rule is created through Configuration, Script Builder, and Review steps before it can be submitted.

2

Pending-approval by default

New and edited rules enter pending_approval state automatically and cannot execute until approved.

3

Role-separated approval

Only administrator or manager roles can approve, reject, or submit rules for approval.

4

Re-approval on change

A rule whose configuration is modified while active is reset to pending_approval until re-approved.

5

Blast-radius percentage caps

Every rule limits the proportion of matched endpoints it can act on in a single execution.

6

Cooldown windows

A minimum interval between firings prevents a condition from triggering a rule repeatedly on the same endpoint.

7

Dry-run simulation

Rules can log a planned execution and report the affected agent count without touching any endpoint.

8

Rollback endpoint

A successful execution's effects can be reversed on the endpoints where the action succeeded.

9

Recorded rejection reasons

Rejected rules carry a documented rejection reason that becomes part of their operational record.

AI platform intelligence

AI is not a single feature — it's an operating layer

AI generates per-endpoint insights, identifies automation gaps, powers the help desk copilot, writes executive briefings, and tracks AI tool adoption itself.

Per-endpoint AI analysis

On-demand experience summary plus Device, App, Connectivity, and Sentiment insights with ranked recommended actions.

AI gap analysis

Scans the rule library and fleet conditions to find automation coverage gaps and recommend new rules with remediation steps.

Help Desk AI Copilot

Turns natural-language questions into read-only SQL against live fleet data, with schema visibility and saved queries.

Executive AI briefings

Generates board-ready summaries connecting telemetry to business language, saved and compared period over period.

AI Tool Adoption Intelligence

Tracks Microsoft Copilot, ChatGPT Enterprise, and Claude Enterprise adoption, engagement, and friction against industry benchmarks.

AI-assisted script builder

Drafts PowerShell, Bash, or Python remediation scripts inside the rule wizard for validation and review.

The rest of the platform

Eight more capabilities across measurement and automation

From peer benchmarking and virtual desktops to orchestration, adoption, self-service, and integration — the platform extends well beyond scoring and rules.

1

Platform architecture and telemetry

Every score, AI insight, and automation rule fires on real endpoint telemetry collected through Satellite Clients and the browser extension — not samples, estimates, or self-reported data.

  • Satellite Clients capture CPU, memory, disk I/O, application events, Wi-Fi, VPN, DNS, and agent heartbeat data from every managed endpoint
  • The DexScoreBackgroundService continuously recomputes composite scores and maintains per-endpoint score history for trend analysis
  • The browser extension adds page load time, interaction latency, and session telemetry for SaaS applications endpoint agents can't see alone
2

DEX peer benchmarking

A DEX score means more with context — the Benchmarking module compares composite and pillar scores against peer organizations by sector and company size.

  • Benchmarks are expressed as peer median scores with 25th and 75th percentile boundaries for the composite score and all four pillars
  • Pillar-level comparison reveals where investment is misaligned — for example, strong device and connectivity scores but below-median app health and sentiment
  • Export and report functionality packages benchmark data for board technology committees, procurement, and compliance reviewers
3

VDI and external network intelligence

As work moves through virtual desktops and SaaS, experience monitoring follows the full path — not just the physical endpoint.

  • The VDI Experience module tracks composite scores, infrastructure-versus-endpoint fault splitting, and session reliability for Citrix and Azure Virtual Desktop
  • The External Network module scores LAN, ISP, and cloud/SaaS path segments independently, pinpointing whether a broken call is the Wi-Fi, the home ISP, or the cloud service
  • Network fault attribution compares all three path segments simultaneously to identify the most likely root cause of a degraded remote experience
4

Visual Flow Designer

Rules handle single-event response. Flows extend automation into multi-step, multi-system orchestration built on a visual canvas.

  • A flow is a directed graph of trigger and action nodes connected by edges, built with drag-and-drop and saved, versioned, validated, and dry-run simulated
  • Native integration nodes for Jira and ServiceNow create issues, incidents, or requests with dynamic template variables like {{hostname}} and {{agent_id}}
  • A curated gallery of seven pre-built flow templates gives teams a complete starting point instead of building every flow from scratch
5

Digital adoption journeys

Deploying software is not the same as adopting it — in-app journeys close the gap between installation and confident daily use.

  • Journeys combine tooltips, spotlights, and multi-step walkthroughs targeted at specific UI elements, published without changing the target application's code
  • Step-level completion analytics identify exactly where employees disengage, so authors can simplify the steps with the highest drop-off
  • Journey completion feeds the Employee Sentiment pillar, correlating adoption with lower crash and hang rates on the applications covered
6

Employee self-service (Employee Assist)

The fastest support experience is one where the employee resolves their own issue, guided by AI, in less time than it takes to type a ticket.

  • A conversational assistant selects the most relevant playbook for the employee's described problem and device context
  • Every recommended action requires explicit employee confirmation before it executes, with the full session transcript recorded
  • Failed self-service escalates to the help desk with the complete diagnostic history already attached, cutting resolution time
7

Work-from-home intelligence

WFH is a permanent operating model that needs the same management discipline as the office — without resorting to invasive monitoring.

  • The WFH dashboard reports remote device compliance rate, productivity threshold compliance, and per-employee productive/non-productive hours
  • Application usage is classified into productive, non-productive, communication, development, creative, or custom categories for fleet-level visibility
  • Employees whose productive hours fall below threshold submit a reason directly, visible to administrators alongside schedule and policy management
8

External integration and scoped API access

The DEX External API connects automation to the broader operational ecosystem without creating a separate automation silo.

  • External systems can list enabled rules, execute a rule against a target endpoint set, and poll execution status through a REST interface
  • Scoped API keys restrict each integration to a specific list of rules it is authorized to trigger, with full rotation and revocation support
  • Webhook action nodes extend flows to PagerDuty, Opsgenie, Microsoft Teams, Slack, and custom internal systems beyond the native Jira/ServiceNow nodes
Implementation

A phased adoption path from first score to enterprise automation program

DEX programs that succeed start with a clear measurement baseline, identify the highest-value automation opportunities, and expand coverage from evidence.

01

Establish the measurement baseline (Weeks 1–4)

Deploy Satellite Clients, verify telemetry across all four pillars, run the initial score rebuild, deploy the browser extension, and run the first AI gap analysis.

02

Activate the highest-value automation rules (Weeks 5–10)

Prioritize System Health and Security rules from the gap analysis, build each through the three-step wizard, simulate and dry-run before activating, then track tickets prevented weekly.

03

Expand to experience and adoption (Weeks 11–18)

Launch sentiment campaigns for Poor-band endpoints, stand up AI tool adoption tracking, configure the WFH dashboard, publish adoption journeys, and connect the automation API to the service desk.

04

Program maturity and continuous improvement (Week 19+)

Review the fleet score distribution quarterly, run gap analysis monthly, and expand the rule library toward full coverage across all eight trigger categories.

Next steps

Start with measurement, automate with evidence

The most successful DEX programs begin with a clear scope, a measurable baseline, and one automation rule that proves value in the first week.

  • Define a scoped starting population — a business unit, location, or device category — to establish a clean measurement baseline
  • Run the first AI gap analysis and identify the three most prevalent Poor-band conditions with the clearest automated response
  • Create, validate, simulate, and activate those first three rules, then track tickets prevented in week one as evidence
  • Generate the first executive briefing within the first month to build organizational alignment, then repeat it on a monthly cadence
Customer outcomes

What organizations gain from a mature DEX program

The value of DEX is measured in time recovered, tickets deflected, risks resolved, talent retained, and investments justified.

Productivity recovery

Mature DEX programs resolve endpoint experience problems 3–5x faster than ticket-driven support, recovering hours of productive time across the fleet every week.

Ticket deflection

Organizations typically report 20–40% reductions in service desk ticket volume in the categories where automation rules are active.

Security posture

Security and compliance rules detect and remediate posture conditions in near real time, lowering mean-time-to-detection and mean-time-to-response.

Talent and retention

Four-pillar DEX scores, sentiment trends, and executive briefings give HR and IT leadership evidence that technology quality — a top-three driver of job satisfaction — is improving.

Next steps

Start with a scoped measurement baseline

A phased rollout that proves value with the first three automation rules in week one builds more trust than a demo — and creates the evidence to expand toward full automation coverage.

Define your scope

Choose a business unit, location, or device category for your initial measurement baseline.

Activate the first three rules

Target the most prevalent Poor-band conditions with the clearest automated response.

Schedule the first briefing

Present the initial DEX baseline and tickets prevented within the first month.